Visual representation of data has become imperative to understand complex information. In this regard, node diagrams have proven to be a reliable tool for the representation and comprehension of related data. In this article, we delve into what node diagrams are, their role in data visualization, and their myriad benefits across several industries.
Understanding the Basics of Node Diagrams
At the most basic level, node diagrams, also frequently referred to as network diagrams, are visual representations that depict connections between different entities. These entities are represented as ‘nodes’, and the relationships between them are illustrated as ‘edges’. The node diagrams can be either directed or undirected, determining if the relationship patterns have one specific direction. Node diagrams make it easier to visualize structures, systems, or abstract concepts in a way that textual or numerical data cannot.
Grasping the Role of Node Diagrams in Data Visualization

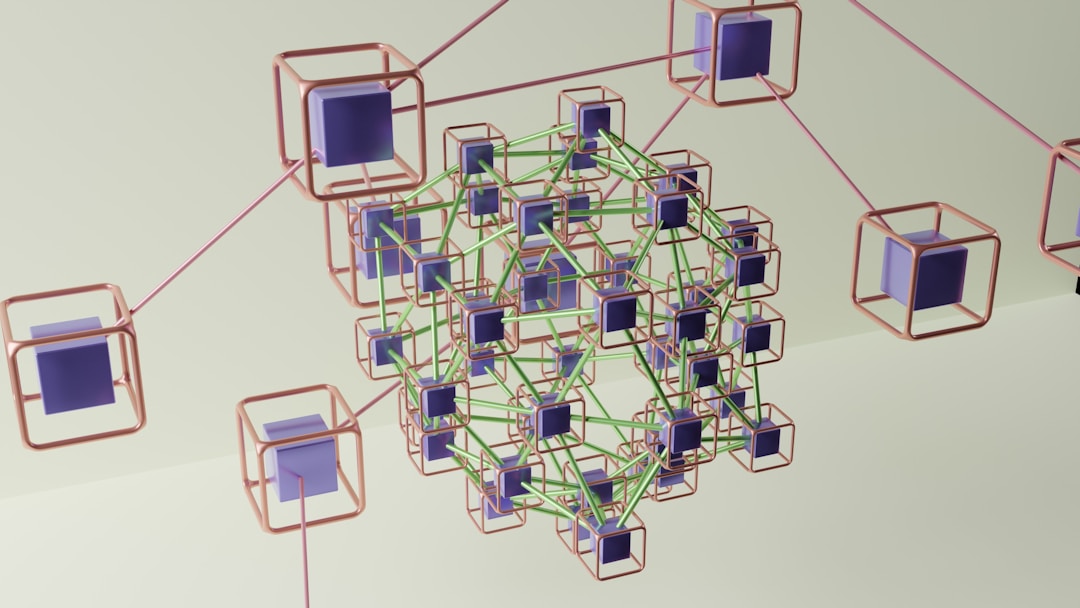
Alt text: An artistic representation of a node diagram using purple and orange nodes with green connecting lines.
With the increasing reliance on data for making informed decisions, visualization tools like node diagrams have become indispensable. They enable patterns, trends, and correlations that might go unnoticed in textual data to be recognized more easily and quickly.
Node diagrams are particularly potent when dealing with complex data with interconnected elements. In this scenario, other forms of visualization, such as bar charts or histograms, may not do justice to the intricacies of the data.
Node diagrams allow users to explore data from different angles, enabling a deeper, more holistic understanding of the information at hand. This assists in seeing the bigger picture and making comprehensive decisions.
Moreover, node diagrams cater to different learning styles. They’re a popular tool among visual learners, who understand and remember information best when they see it visually represented.
Enriching Communication With Node Diagrams
Effective communication is key to success, especially in a business setting. With the help of node diagrams, complex topics can be translated into clear, simple visuals increasing the understanding and engagement of all participants.
Node diagrams facilitate better communication by showcasing relationships and the flow of information. They paint a picture of patterns and structures, making it easier for diverse teams to grasp complex concepts and communicate effectively.
Moreover, node diagrams serve as a single source of truth, minimizing the chances of miscommunication. They sum up information that could take countless spreadsheets, sliders, or texts to explain.
Powerful Uses of Node Diagrams Across Industries

Alt text: A business professional building a node diagram on a laptop.
Node diagrams have proven to be an effective tool across many industries. In the IT world, they’re routinely used to map out networks and databases, offering a bird’s eye view of complex systems.
Design and graphic teams use these diagrams to create website architectures or user flow charts. In logistics and retail, node diagrams assist in streamlining supply chains and inventory management.
In academic and research settings, node diagrams trace relationships among variables, leading to innovative findings. In the corporate world, they’re effectively used to visualize business strategies and operational models.
Transforming Operations With the Benefits of Node Diagrams
Utilizing node diagrams can yield several benefits, helping enhance productivity. They provide a clear, organized view of complex structures, saving time and facilitating faster and better decisions.
Node diagrams can aid in identifying bottlenecks, redundancies, or other opportunities for improvement in a system or process. By doing so, they contribute to more efficient processes and promote continuous improvement.
They also assist in foreseeing the consequences of adjustments in systems. As such, potential problems can be spotted and addressed in advance, minimizing risks associated with strategic decisions.
Lastly, they serve as effective training tools, helping team members understand their role and the larger system they are a part of. This way, node diagrams support team alignment and collaboration, ultimately leading to better business performance.
Overall, the versatility and the potential of node diagrams in analyzing, communicating, and improving complex structures is substantial.


